WHAT IS HAPPENING WITH BICYCLE USE? RESEARCH TELLS A MIXED STORY.
By Steve Bina
A while ago I wrote a critique of a PeopleForBikes (PFB) Bicycling Participation Study. That critique wasn’t meant to be judgmental, but rather to render an opinion on what the data was saying. Now I have access to a similar data set from the National Sporting Goods Association (NSGA). Let’s take a look at what that data presents compared to the PeopleForBikes survey.
The PFB survey only showed data going back 10 years, to 2014, and displayed that data in 2-year increments: 2014, 2016. 2018. 2020. 2022 and 2024. The NSGA data set goes back to 2000 and displays data for each year up to 2024. The PFB survey included riders as young as three years old, while the NSGA used an age cutoff at seven years of age. Both surveys measure ridership in two buckets, one to five days, and six days or more.
Before I get into specific comparisons, it’s important to recognize the significance of the long-term bicycling participation in the country. As mentioned above, the NSGA survey has data going back to the year 2000 through 2024, a quarter century. What does the NSGA survey show? Below are the numbers.

In the first 25 years of the new millennium, the population of the United States increased 57.9 million, or 20.5 percent. According to the NSGA survey, the bicycling participation of one or more days increased 9.8 million or 18.6 percent. While both the general population and the participation population increased, the actual participation relative to the total population decreased by three tenths of a percent. To be blunt, on a percentage measurement, fewer people than ever are riding at least one day per year as a percent of population.
Perhaps more concerning is the breakdown between participation of one to five days and six or more days in the survey. In 2000, the NSGA survey shows one to five days participation of 9.6 million or 3.4 percent of the total U.S. population. By 2024, the one to five days participation grows to 21.9 million, more than double in raw numbers or 6.4 percent of the total U.S. population.
However, the six or more days participation tells a more troubling story. In 2000, the survey shows 43.1 million participants, 15.3 percent of the total U.S. population. By 2024, that number dropped to 40.6 million participants or 11.9 percent of the total U.S. population. Using the raw numbers, it can be said that regardless of how many days a person rides a year the participation has increased (52.7 million in 2000 versus 62.5 million in 2024). In reality, a smaller percentage of Americans are riding than at the turn of the century. It seems a lot of people gave bicycling a try for a few days but didn’t stick with it over time.
Why this happened has many theories. Bicycles were not being maintained properly. Riders were outgrowing their bikes and not upgrading them. Leisure time diversions like video games became more interesting. Less free time with more activities competing for that free time coupled with the need to move farther and faster to participate. No mainstream American cyclists like John Tomac or Eric Heiden to pique interest in cycling. Whatever the reason, and you undoubtedly have your own not mentioned here, the overall participation in bicycling is dwindling with no turnaround on the horizon.
So, how do the PFB and NSGA surveys compare?
For survey years between 2014 and 2024 for the 6+ days of riding, the PFB survey shows a decrease of 2 million participants, from 73 million to 71 million. That represents a 2.7 percent decrease in participation in this time period and a two percent decrease relative to the total U.S. population.

To keep the surveys comparable, using the same survey years for the NSGA for 6+ years of riding shows an increase of 5 million participants, from 36 million to 41 million. That represents a 13.9 percent increase in participation over that same period. In this survey, participation increased as a percentage of total U.S. population as opposed to the decrease in the PFB survey. The bump in participation because of the pandemic should have played out the same in both surveys, but appears to be more long-lasting in the NSGA survey.

Additionally, the PFB survey shows participation at 6+ days to be 20.9 percent of the U.S. population in 2024, while the NSGA survey shows only 12.1 percent. Part of this might be explained away because of the age difference of the respondents in the two surveys, as noted above, though to me it’s doubtful that would account for 30 million people.
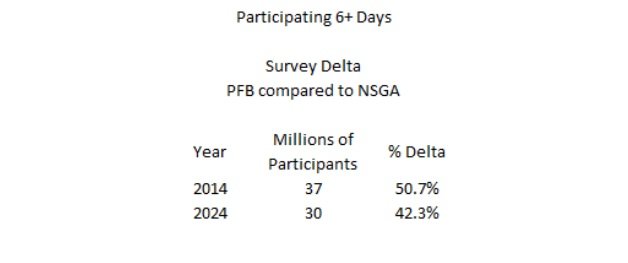
It is notable that the raw participation numbers in the two surveys are dramatically different. The PFB survey shows 37 million more participants, a 50.7 percent increase over the NSGA survey, in 2014. That drops to 30 million more participants in 2024, but still 42.3 percent higher than the NSGA survey.
How does the breakdown of the 1+ days participation compare between the two surveys?
For survey years between 2014 and 2024 for the 1+ days of riding, the PFB survey shows an increase of eight million participants, from 104 million to 112 million. That represents a 7.7 percent increase. That may seem indicative of an increase in participation overall for the population. However, the percentage participation only increased two-tenths of a point relative to total population from 32.7 percent to 32.9 percent.

To keep the comparison comparable, I’m again using the same NSGA survey years. The NSGA survey shows an increase of 15 million participants in those same 10 years, a 31.3 percent increase. In terms of participation relative to total population, it increased by almost 3.5 percent, from 15.1 percent to 18.5 percent.

As before, the raw participation numbers remain dramatically different. The PFB survey shows 56 million more participants, 53.8 percent more than the NSGA survey in 2014. For 2024 the PFB survey shows 49 million more participants, a 43.8 percent increase over the NSGA survey.

This comparison between the two surveys over the last ten years and the discrepancies of the results raises more questions than it answers. I find it problematic that the 6+ day participation in the PFB survey remains just under 21 percent of the total population in 2024 (and less than the 22 percent of 2014) while the NSGA survey is just over 12 percent. These low levels of participation in the face of a 21.7 million increase in total population over those same 10 years should be a concern to your business and the industry. It must be noted that both surveys looked at participation without regard to channel of distribution or whether the bicycles used were new, used, e-bikes, or analog.
Admittedly, the country and industry have weathered the pandemic, which could have skewed some of the data. However, the trend seems unmistakable. Certainly, there have been ups and downs over the past 25 years. The same for the 10 years covered by PFB and NSGA. Overall, the participation numbers are much higher over those 10 years in the PFB survey than in the NSGA survey.
I make no conclusions about which survey might be more accurate concerning cycling participation. My original article brought up some inconsistencies in the PFB survey, and you may wish to take a look at a previous HPS Bicycle Business Reporter to better understand the numbers in that survey.
Regardless, as you peruse the data presented here, I submit this is the question you should ask yourself concerning accuracy and what it might tell you about consumer choices; Which survey and data set do you feel best reflects what has been happening recently in your business and in your market versus which one might be overly optimistic?
Contact Steve Bina: steve@humanpoweredsolutions.com