THOUGHTS ON BICYCLE PARTICIPATION
By Steve Bina
Recently, PeopleForBikes published a Bicycling Participation Study using a 2024 survey of U.S. residents. For the bicycling industry as a whole, manufacturers, distributors, and retailers, this has the potential to be an interesting and useful study. I was eager to dig into the numbers.
It is worth noting this study looked only at rider participation and not retail sell-through regardless of channel, IBD, mass merchant, or direct-to-consumer. Other articles in this issue of the HPS Micromobility Reporter discuss the slow sales, significant inventory write-downs, and profit erosions of major Taiwanese manufacturers in 2024. These indicate 2024 was a tough year for the bicycle business, and 2025 might not be much better as the industry continues to work through these issues.
The first table in the PeopleForBikes Bicycling Participation report showed data in two-year intervals from 2014 through 2024, six data points total. The first table in the study showed overall participation by “…Americans ages 3 or older.” That seemed a little young to me, but I figured I’d wait to see what the survey revealed.
The table had two columns, participating 1+ days and participating 6+ days. This initial data shows 35%, or 112.3 million Americans rode at least 1 day in 2024 but no more than 5. At the 1+ day participation through the six years tabulated, the participation ranged from a low of 32% (2016 and 2018) to a high of 35% (2024.)
The data from the 6+ days was less rosy. The percentage of Americans riding this often ranged from a low of 21% (2018 and 2022) to 24% (2014.) The percentage in 2024 was just 22%.
The percentages for both are worrisome.
The next two tables broke down participation into two parts, riding for recreation and riding for transportation. The same grouping was used for these as was used for overall; Americans 3 years or older, participating 1+ days, and participating 6+ days. The initial data shows 31%, or 101.8 million Americans rode at least 1 day in 2024 but no more than 5. At the 1+ day participation through the six years tabulated, the participation ranged from a low of 29% (2018) to a high of 32% (2014.)
The data from the 6+ days was worse. The percentage of Americans riding this often ranged from a low of 17% (2022) to a high of 21% (2014.)
On the Transportation table the Participating 1+ days shows 19% or 60.6 million and ranged from a low of 14% (2016 and 2018) to a high of 19% (2024.)
As I looked at the number of participants in each of the groupings, I quickly realized the numbers displayed didn’t add up. The following table illustrates what I mean.
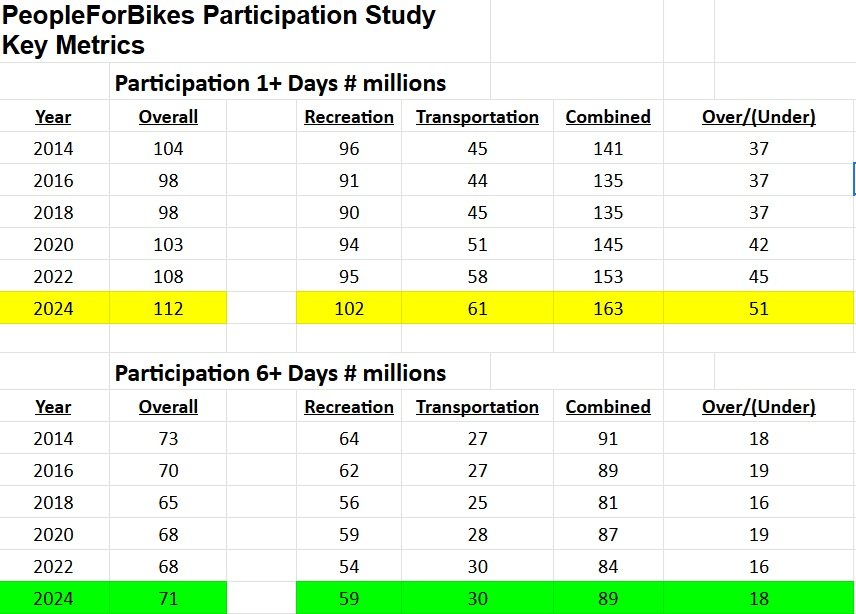
For the numbers highlighted above, the overall participation at 1+ days is 112 million Americans. However, when you add the same grouping of participation for recreation and transportation, the combined participation is 163 million Americans or 51 million additional participants. That’s an increase of 45.5%
For the numbers highlighted above, the overall participation at 6+ days is 71 million Americans. However, when you add the same grouping of participation for recreation and transportation, the combined participation is 89 million Americans or 18 million additional participants. That’s an increase of 25.3%.
It was suggested to me that the discrepancies noted above might be the result of respondents splitting their usage between recreation and transportation, which washes out when combined. There might be some truth in that, but I don’t believe that’s the case. There was no clarification of usage in the study. I assume data presented as “overall” would represent the total “overall” accumulation of data. Regardless, increases of 45.5 % and 25.3 % are significant. Thus, my assumption of the data in the tables as presented simply do not add up correctly, hence I would question the reliability of these numbers.
Another aspect of this study is the percentage presentation of “all bicycling” for each, overall, recreation and transportation. While I’ve shown the data of 1+ days and 6+ days, there is another table showing bicycle riding frequency. That breakdown is occasional (1-24 days), moderate (25-103 days), and committed (104+ days). These designations are interesting, but I’m not sure how they can help predict sales or the status of manufacturers’/distributors’ inventory.
Moreover, why is riding frequency broken out in two different ways? Is one more telling than the other? Are these three groupings more significant/actionable than the 1+ and 6+ groupings?
The study makes the distinction between riding participation and riding frequency. Participation is the percentage of Americans riding regardless of how often a person rides. The study notes there is no statistically significant difference in participation since 2022. In terms of frequency, the average number of days ridden decreased from 2022 to 2024. Again, these are worrisome statistics for the industry.
There are a lot of interesting data points in the survey. Males are more likely to ride than females. Middle-income Americans tend to be less likely to be bike riders. (Do you routinely ask for your customers’ W-2s?) Conservatives and independent Americans tend to be more likely to be riders than liberals. (Do you routinely ask your customers political leanings?)
In addition, any implication that these participation numbers/percentages are evidence of a turnaround happened in the industry in 2024, especially in light of the aforementioned difficulties of the major Taiwanese manufacturers, would seem in conflict.
There are a lot of interesting findings in the PeopleForBikes study, but not much grist for how the industry is doing or what to expect in the coming year.
The buried nugget in the survey (on page 21) is that people who rode outdoors “…only decreased by 6 percent from 2022 to 2024.” Only decreased?
That’s the most useful data point in the whole study.
Contact Steve Bina: steve@humanpoweredsolutions.com